When I first started out as an investor, I was overwhelmed by hundreds of stocks listed in the market. It is extremely difficult for a newbie to find the right stock. Luckily, I found the KLSE Screener app in Google Play Store, which is the perfect tool that helps me in stock filtering.
KLSE Screener App is pretty self-explanatory. It is designed to screen Malaysian stocks with various financial ratios. We can use it on either its website or mobile app. If you are new to it, you can download its app from App Store or Google Play Store.
Note: There are a few interface differences between the iOS app and the Android app. I am using an Android phone myself, so it is okay to notice some differences in your iOS version app.
Why Use KLSE Screener App
Other than a stock screener, KLSE Screener App packs with many features for scanning and analyzing stocks. Moreover, all of them are totally free to use. In my opinion, it is one of the must-have apps if you are investing in Bursa Malaysia.
Read More: 3 Stock Investing Apps You Should Install When Invest in Malaysia
Customize Your Home Page on KLSE Screener App
Before we start screening for stocks, let us start from its home page. This app is packed with functions such as a stock screener, stock search, entitlements (Dividends), news, announcements, and P/L (profit or loss).
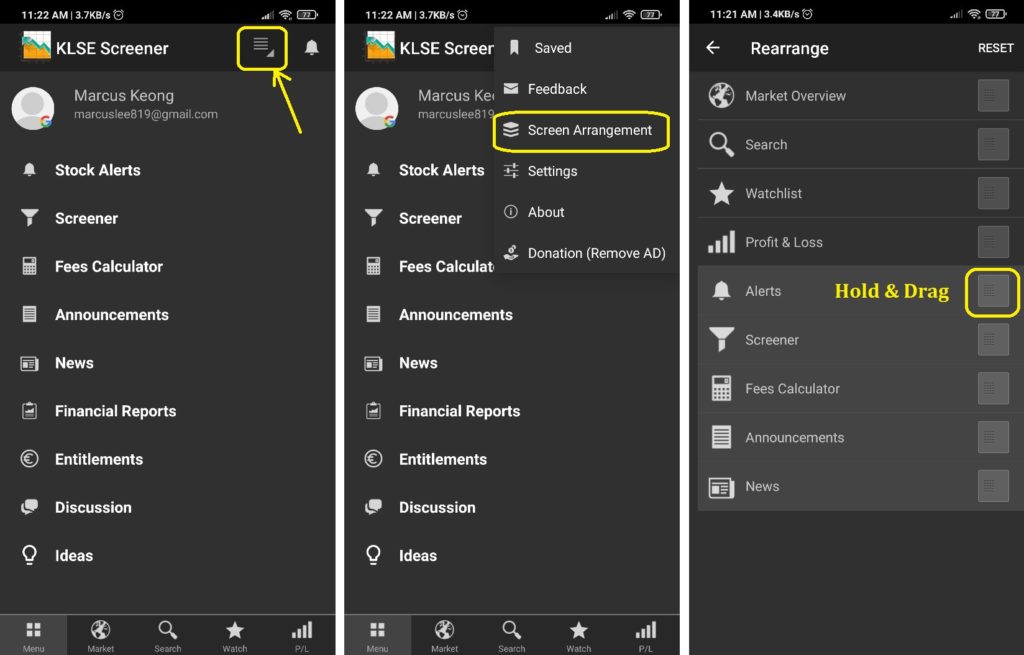
The image above shows how you can rearrange your menu tab. The first 4 items will be shown as the menu tab below your app. For me, I prefer to have “Market Overview”, “Search”, “Watchlist” and “Profit & Loss”.
Here are some brief descriptions on all the menu available:
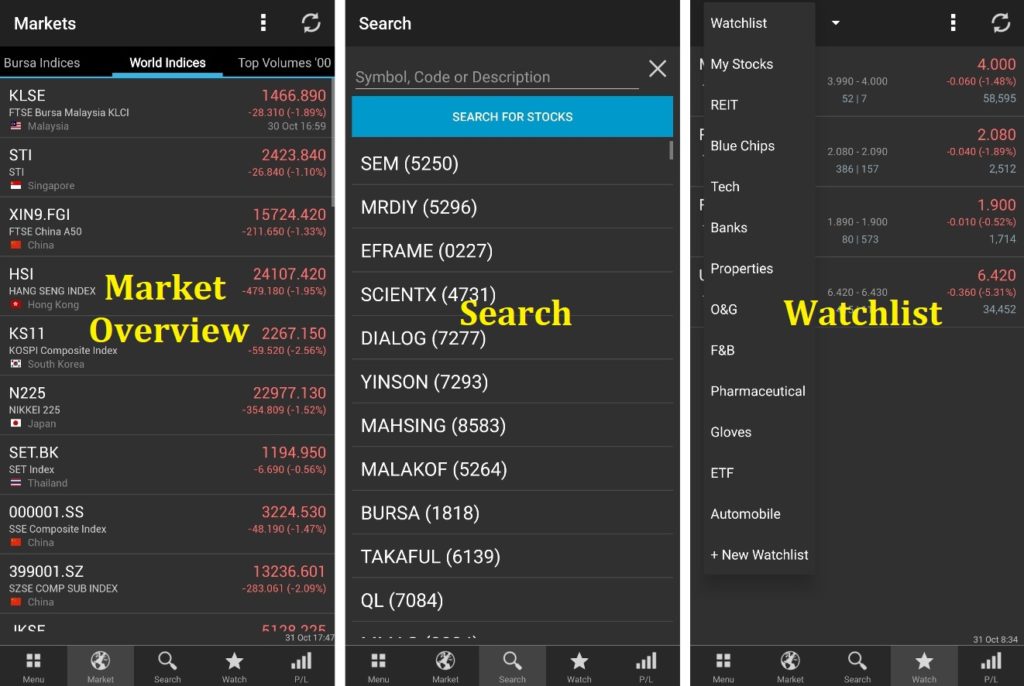
- Market Overview: Showing indices such as KLCI, and various stock list of Top volumes, Top Gains, and Top Loss.
- Search: A search bar to search for stocks listed in Bursa Malaysia.
- Watchlist: A stock watchlist. You can create up to 20 customized stock watchlists.
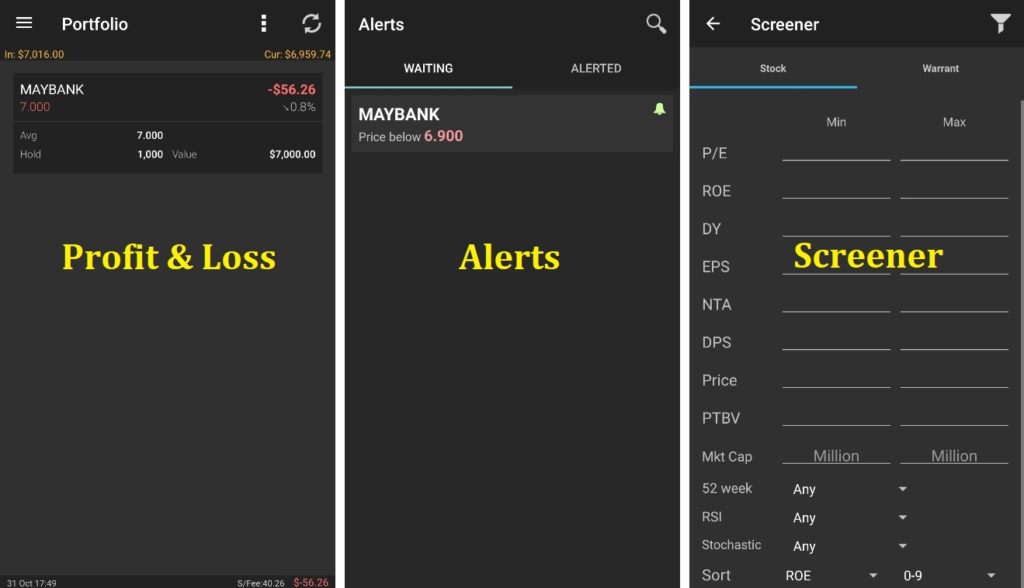
- Profit & Loss: Your stock portfolio that requires us to manually input buy/sell transactions.
- Alerts: The stock price alerts when it hits a certain price or %.
- Screener: The stock screener with various filters.
- Fees Calculator: A calculator for calculating the brokerage fees, stamp duty, and cleaning fee.
- Announcements: Any announcements made by the company under the stocks.
- News: The column for news related to stocks.
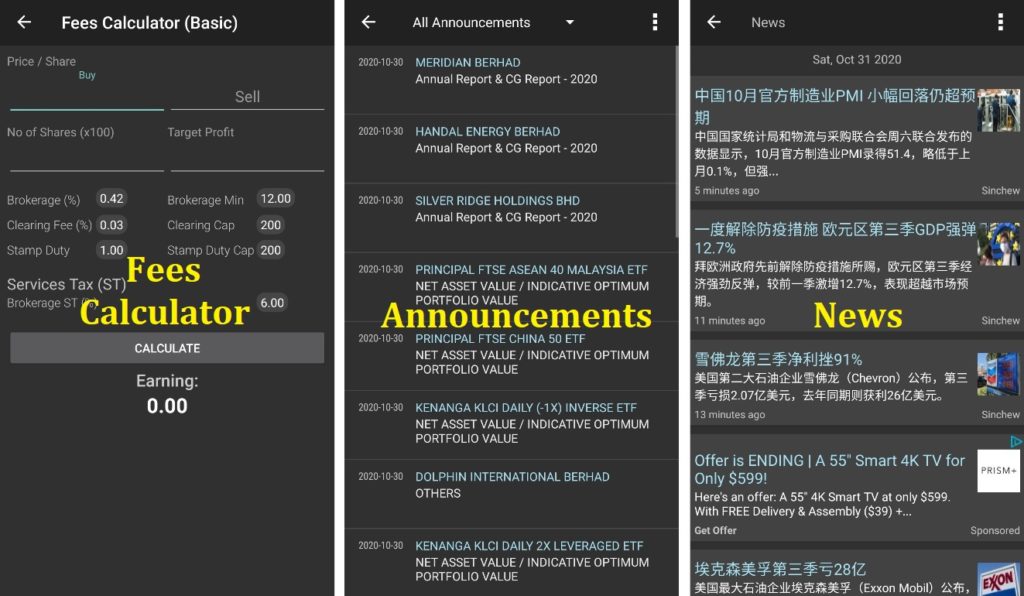
Tips for News Section: Unable to read Chinese? You can translate them by tapping on the 3 dots at top right and select “Translate”. It will automatically translate the news into English.
Screen For Good Stocks in KLSE Screener App
There are many financial ratios that we can use to filter stocks. For now, I will explain some financial ratios that I always use to screen for stocks.

1) P/E (Price/Earnings) Ratio
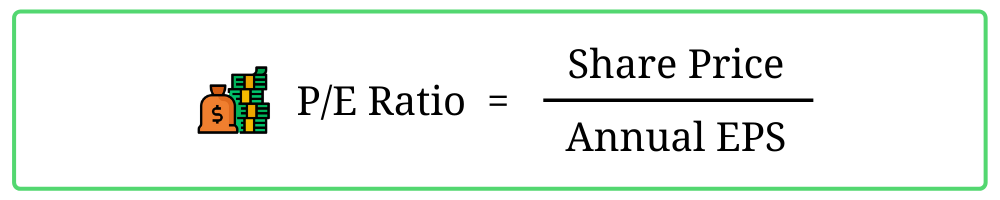
Price over Earnings ratio is best to gauge whether a stock is undervalued or overvalued.
Literally, the P/E ratio value means that the number of years needed for an investment to generate earning that equivalent to the investment. For example, if a stock’s P/E ratio is 10 and the total investment is RM10 million, it means the company will be able to earn RM10 million in 10 years.
Personally, the maximum P/E ratio I can accept is 25. So any stock has a P/E ratio above 25, I will mark it as overvalued. If the company has attractive earnings growth and prospect, then I will add it to my watchlist and wait for any buying opportunity.
Sometimes there is an exception for this P/E ratio range such as a one-time loss in one quarter. If one quarter has a negative earning per share (EPS), it will cause the P/E ratio to be abnormally high. This will require some experience in stock screening to identify that special case.
Nevertheless, we should not rely on this ratio only for the whole stock valuation. It is after all just a ratio for quick filtering.
2) ROE (Return on Equity)
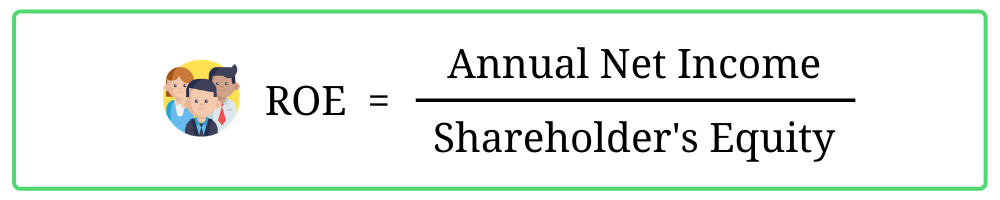
Return on Equity is another good ratio for checking how efficient a company can generate earnings. Based on its formula, we divide company earnings by shareholder’s equity. In other words, it shows how much the company can earn based on total investment by the shareholders.
For me, I would favor companies with at least 10% of ROE. Higher ROE means the company has strong earning power. That’s the good company we are looking for.
3) DY (Dividend Yield)
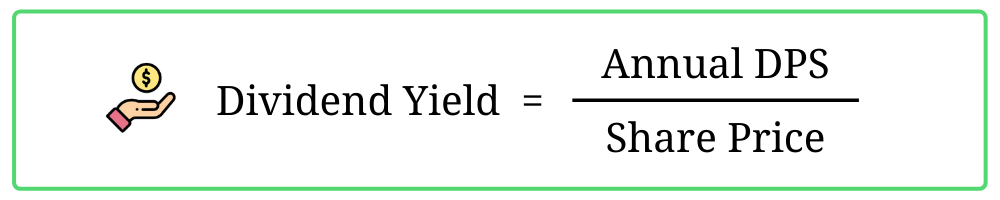
Dividend Yield is basically the percentage of the dividend distributed from the current stock price. A higher percentage means the company usually distributes a high dividend amount to its shareholders.
For me, I always love stocks that distribute high dividends. These stocks might not have a potential capital gain, but it will usually have stable returns and help to replenish my warchest in the long run. A stock that gives more than 4% of dividends is considered decent.
Despite that, there’s a caveat for using this ratio. Based on its formula, this ratio will constantly change depending on the stock price. So investors should be wary of “value traps” set by a few companies to attract shareholders.
Although I only explain on these 3 ratios, you should check out what other ratios or values mean. Keep playing with it, and one day you will become the sifu of stock screener. Practice makes perfect. 🙂
Create Your Stock Watchlist in KLSE Screener App
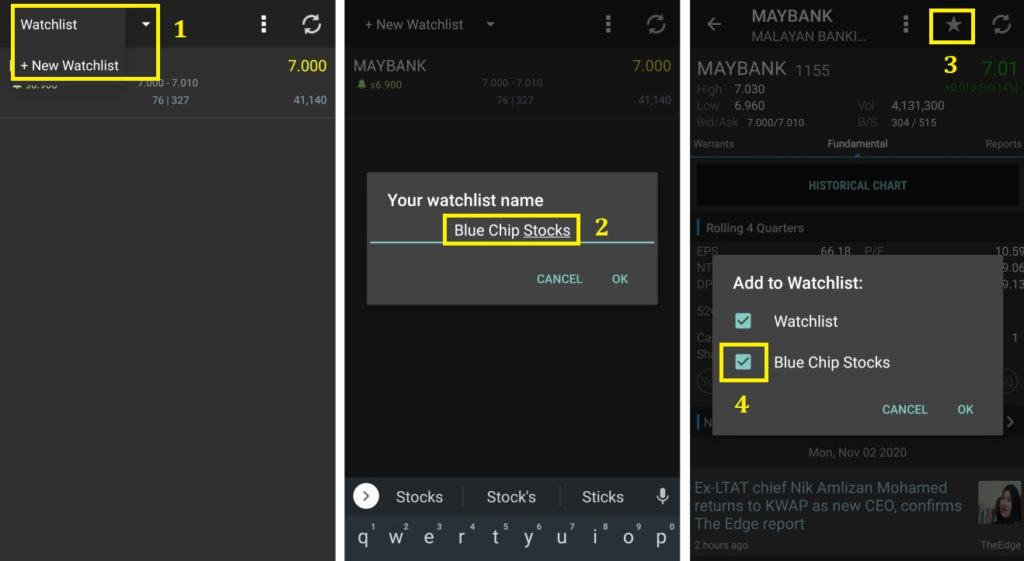
When you just started using this app, there is no pre-set stock watchlist for you. So you have to build it from scratch. The image above shows you step by step on creating a new watchlist (1, 2) and adding a stock into a watchlist (3, 4).
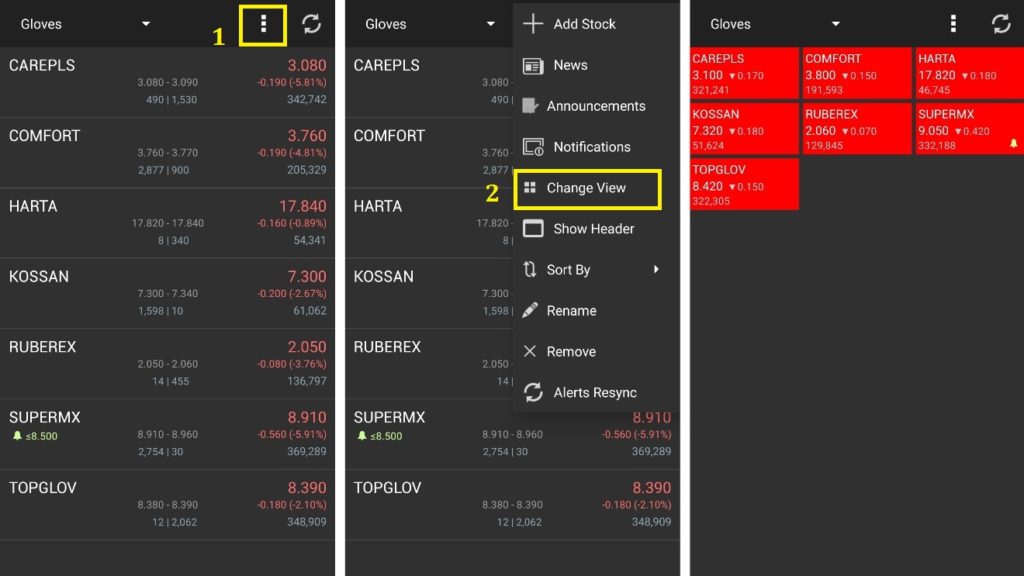
There are two types of view available for your watchlist: the details list and the heat map view. You can easily switch between these two views by following the steps given in the image above.
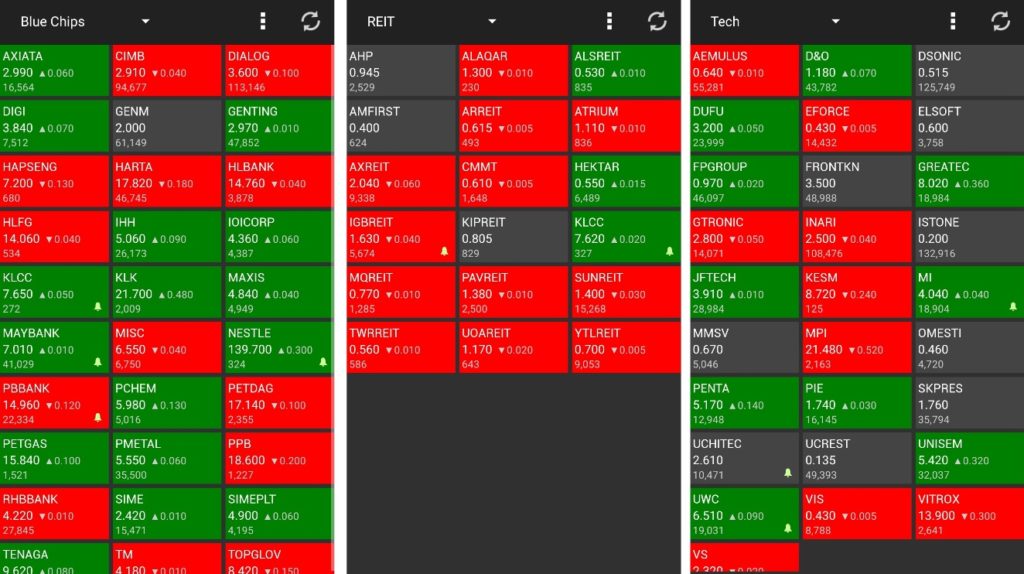
If you are a new investor or a new user of this app, you’re in luck. Because I will share 3 watchlists I have with you, free of charge, haha! You’re welcome!
Search for a Stock in KLSE Screener App
You have created some stock watchlists. Now you just need to search for the stocks and add them in. Other than the stock symbol, we can use the company name to search for its stock.
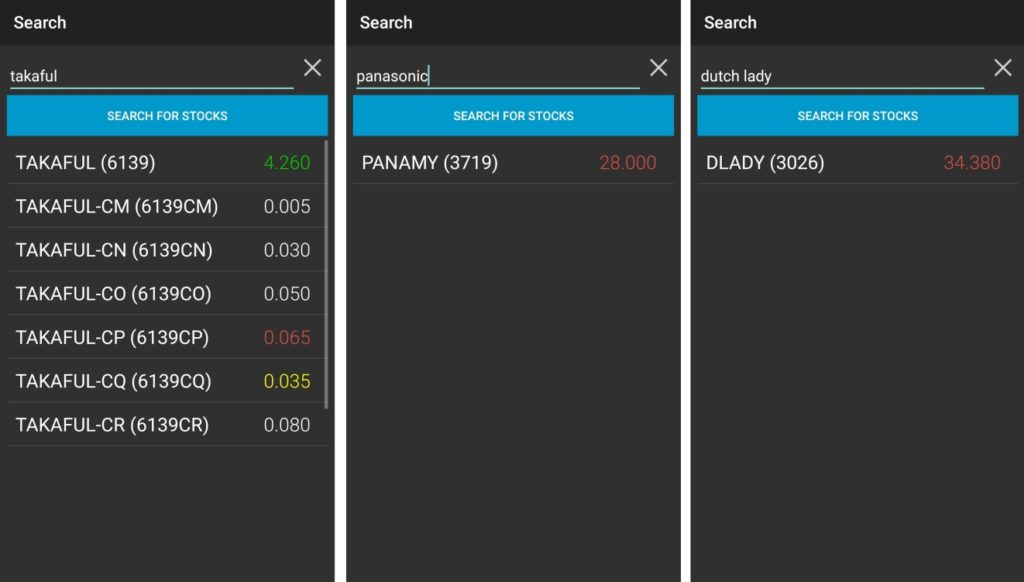
For example, we can use “Dutch Lady” to search for DLADY stock (as shown in the image above). Alternately, you can also search by its stock number (3026 for DLADY).
How to Check the Financial Performance of a Stock
So you know how to search for stocks in KLSE Screener App already. But do you know how to check the performance of the stock?
By tapping on the stock, we can see a lot of fundamental ratios and values. If you are still new to stock investing, those figures will probably look confusing.
I will briefly guide you on looking at several key values. These values will determine if the company has a good financial performance or not.
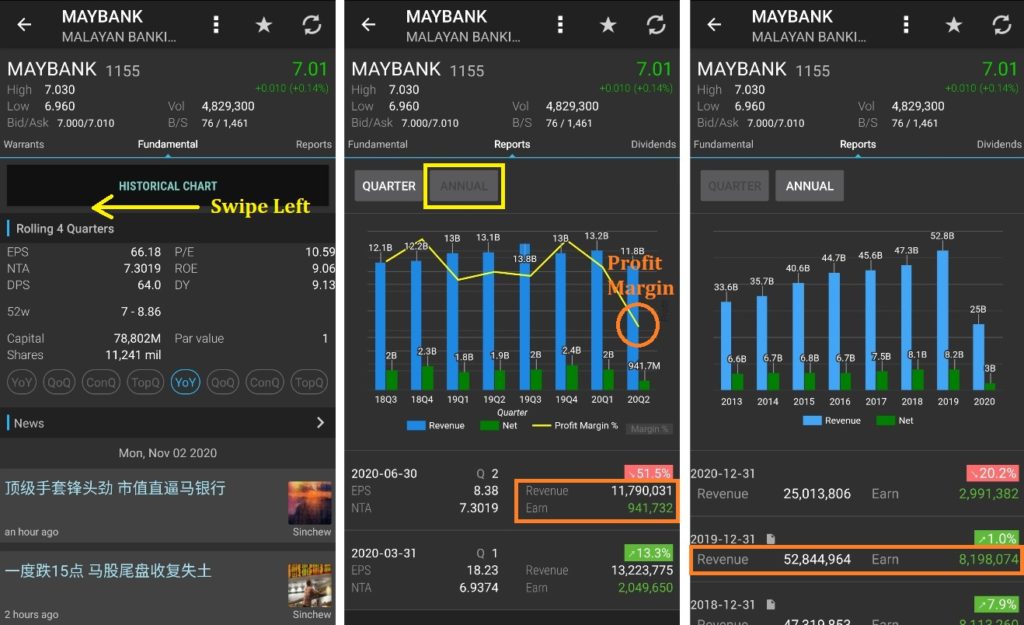
Under the “Fundamental” tab, you probably know a few ratios already as I mentioned above (P/E, ROE, DY). To check for the company’s revenue and earnings, we swipe left to its “Reports” tab.
Those bar charts represent the revenue and earnings of the company. Revenues are the blue bars while earnings are the green bars. If you tap on the yellow line chart (highlighted in orange circle), you can view the profit margin of that quarter.
By default, we will see the quarter results of the company first. If we want to view annual results, just tap on the “Annual” button (highlighted in a yellow rectangle).
The Key Values of a Stock Financial Performance
- Revenue: The total sales or income that a company earn.
- Earnings: The net income after deducting costs and expenses from its revenue.
- Profit Margin: It is the percentage of net income over revenue, a measure of profitability for a company.
In essence, we will want to see both revenue and earnings are positive. Across the years, it will be great if the revenue and earnings of the company keep growing.
Meanwhile, I always prefer a company that has at least a 10% profit margin. The higher the profit margin, the better the company at generating profits or cost reduction, or both.
Obtain The Financial Statements of a Stock
So you already know how to check the company’s revenue and earnings. Does it sufficient for you to know if the stock is good to buy? Unfortunately, no.
We also need to learn how to look at the financial statements as well. There are many clues in the financial reports which most investors did not even bother to read.
I won’t share how to read the financial statements in this article. Instead, I will show how to access them via the KLSE Screener App.
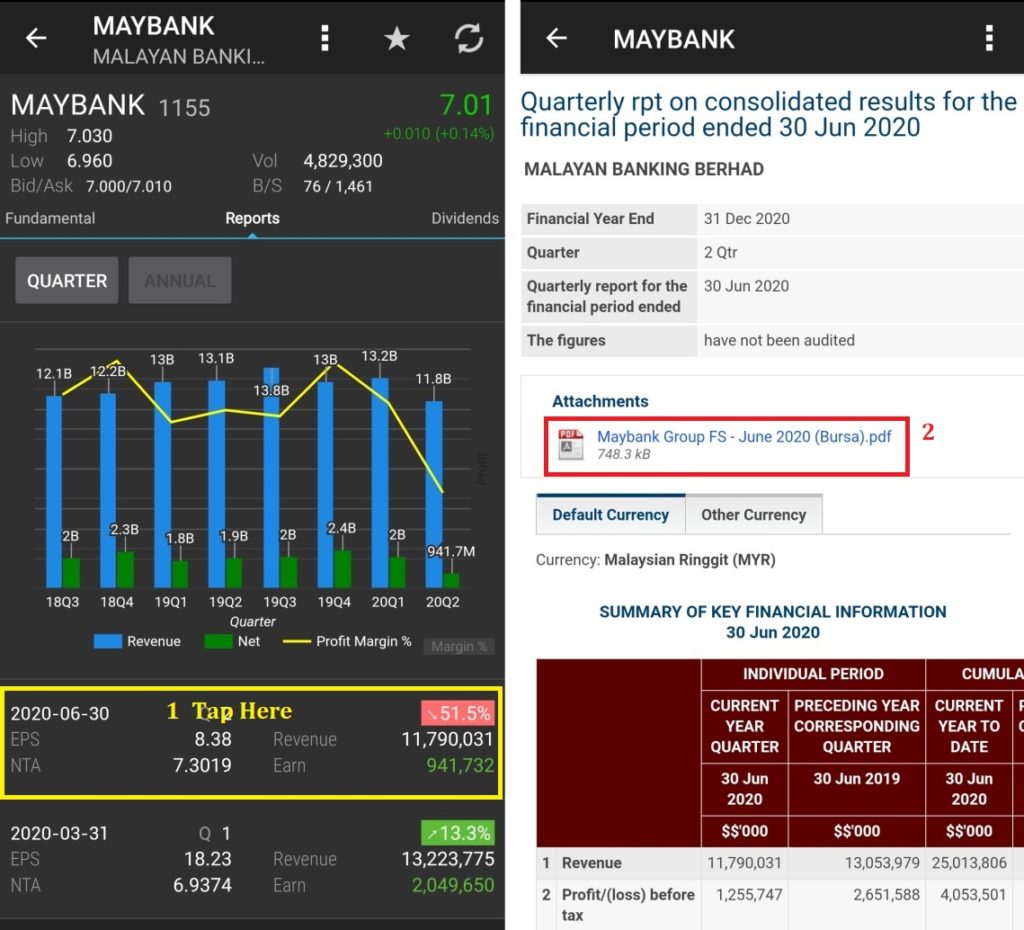
The image above shows how you can access the quarterly report of a stock. You just have to tap on the result and it will link you to its Bursa Malaysia’s attachment.
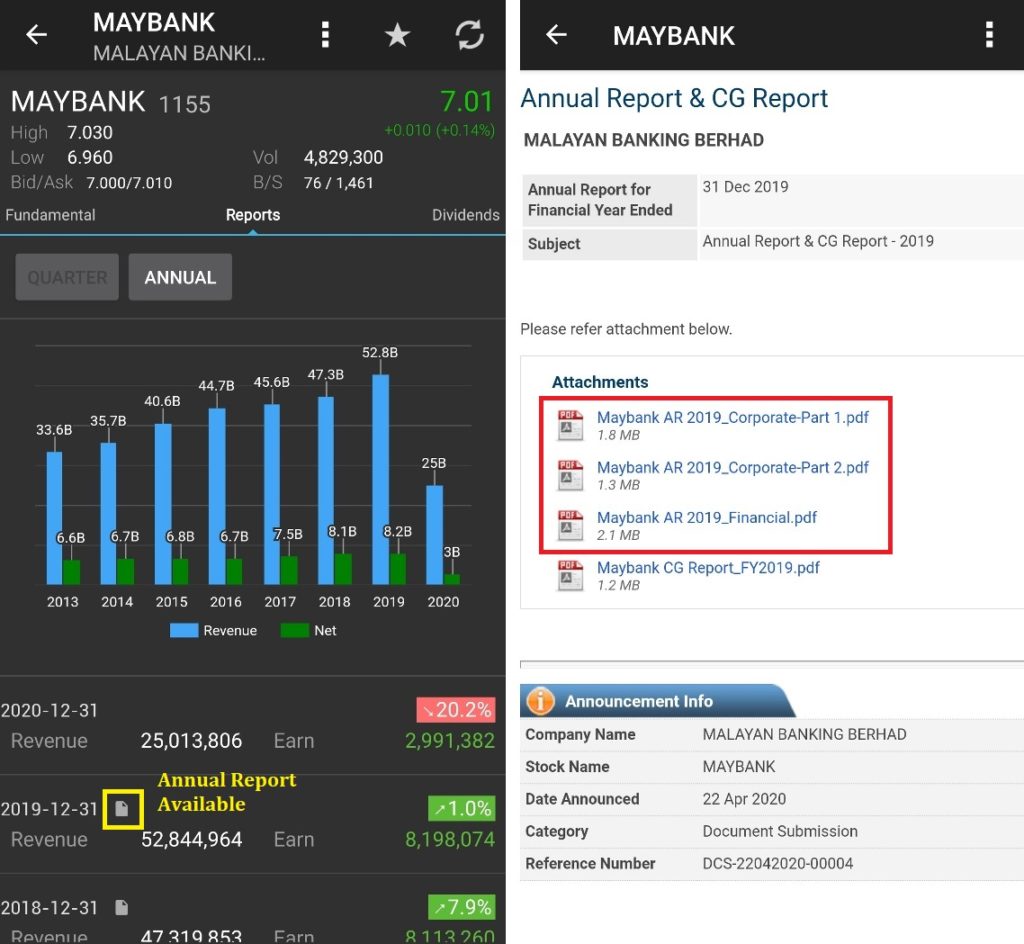
Similarly, you can access the annual report of the stock on the annual tab. But one thing to note is you can only find the annual report in the result with the icon highlighted in the image above.
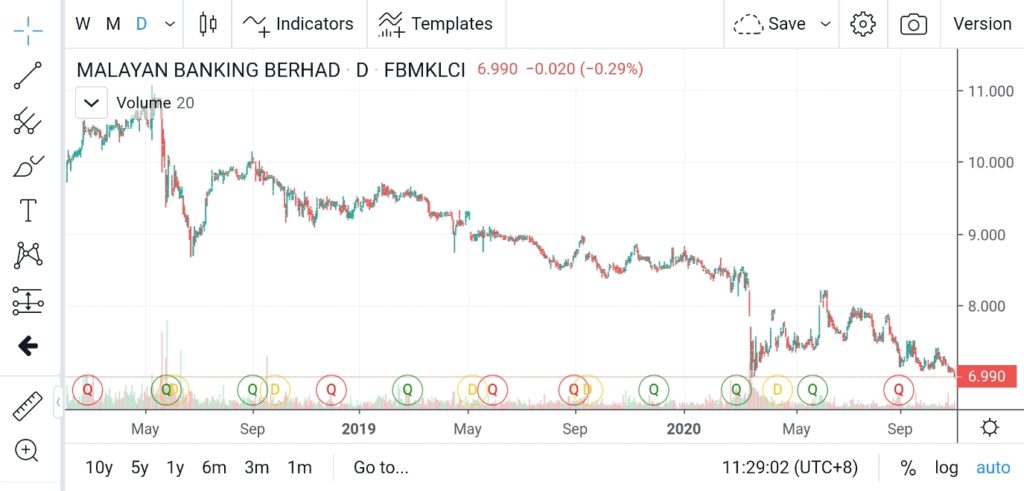
Check the Stock Price in Different Time Range
To check the stock price, you can easily access it by tapping on (1) “Historical Chart”.
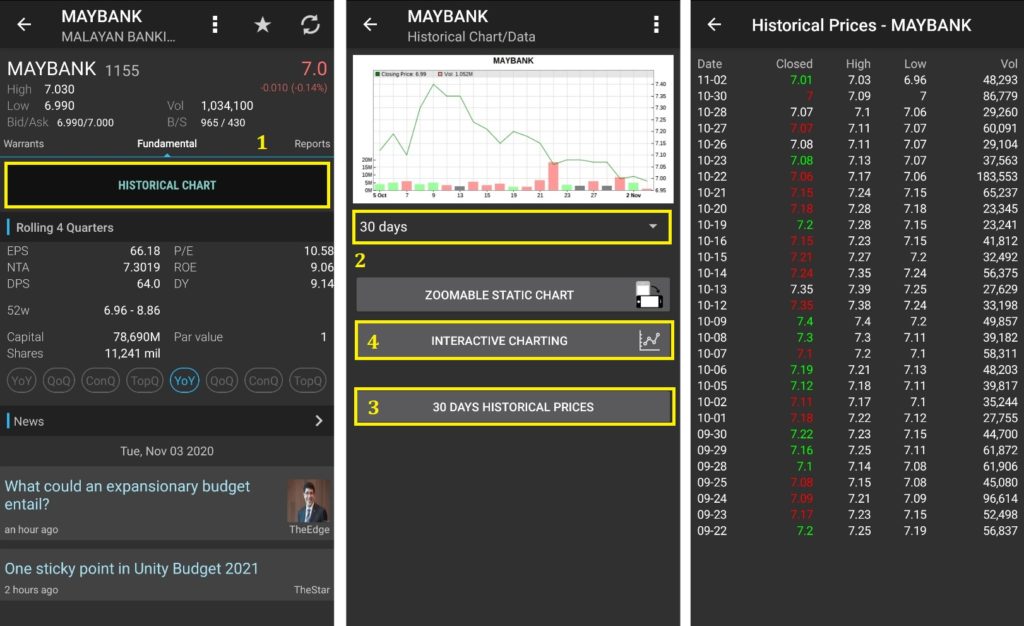
We can change the chart to candlestick by tapping on the 3 dots at the top right and choose “Chart Options”. We can choose different time ranges at the drop down list (2) from 1 day to 10 years.
Besides the chart, there is also an easy one-glance 30 days historical prices (3) with traded volume. If you want to view the historical charts with more details, you can check out (4) interactive charting as shown in the image below.
Set Price Alert in KLSE Screener App
If we complete our stock analysis and have an entry price, there is one useful feature for that. KLSE Screener App allows us to set alert for stock when it hits the price we set.
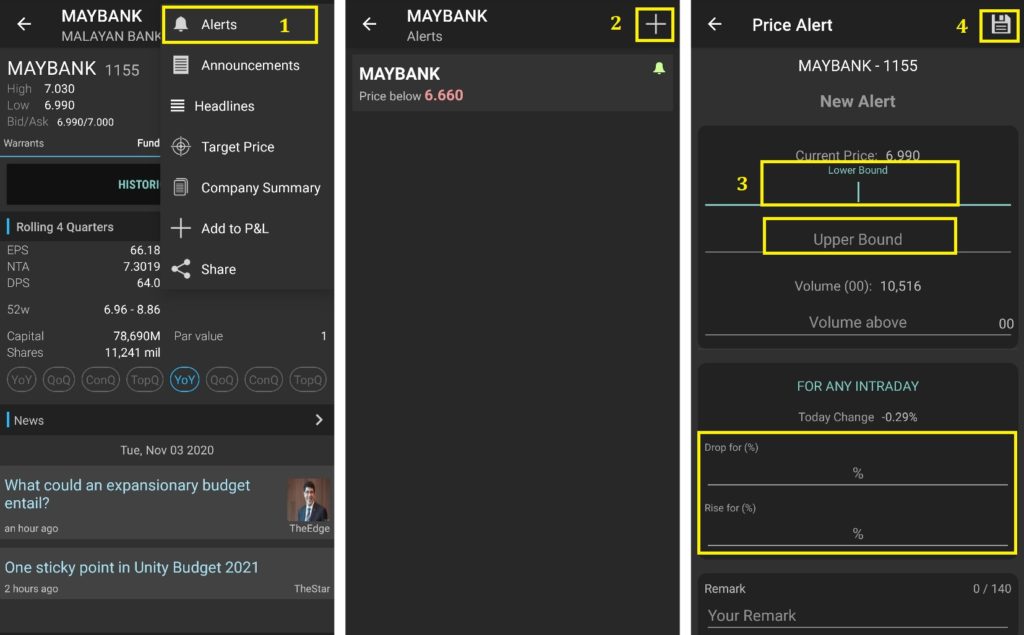
Basically, we can set alerts in the stock by tapping on 3 dots at the top right > Alerts > “+” symbol. The lower bound means the alert will be lower than the current price, while the upper bound is above the current price. We can also set an alert for the daily % change. Don’t forget to hit that save button (4) after you set it.
Summary
Although this article is titled “A Comprehensive Guide”, I still haven’t include things like Dividend Announcement, fees calculator, stock announcements, and news. If I try to cover all the features in the KLSE Screener App, it will be a 3000 words long article. So I better avoid that.
Nevertheless, I hope the above guide can give you some knowledge of screening stocks and identify good stocks. I won’t say it is a complete guide, but it covers most of the solid fundamentals for a stock investor. There are actually more investment apps that can help you through your stock investing journey.
Read More: 3 Stock Investing Apps You Should Install When Invest in Malaysia
Blog Update & Social Media
If you like this article, then you may like my other articles as well. If that so, feel free to subscribe to my newsletter so you can get the latest update from me when I posted a new article. 🙂
[mc4wp_form id=”236″]
Also, you can also get my new blog post updates by following my social media below. Don’t be shy and feel free to interact with me as well. See you there!
Hi Marcus, I am wondering how to set adjustable chart in klse screener?
It shows a big gap after the counter is bonus issued
Hi Darren, I don’t think the app allow us to do that. But I believe they will be auto adjust after some time.
Hi ,
May I ask in klse screener trade details got red, green and white. White means?
Hi, white means it remain unchanged.
I use mobile app to view interactive stock chart. How to exit the interactive chart?
Hi Alex. Just press the “back” button on your phone.
Which watchlist/stock is worth observing at this point of time (14 jan 2021)?
I would say stocks that have been heavily impacted by the MCO, such as entertainment and retails business.
Can i change profile name in KLSE Screener apps?
It is linked with your Google account. Just change in Google account
Hi Marcus, when I’m inside the interactive charting, which indicators do I choose if I want to see the support and resistance level of the stock?
Hi Alvin. I don’t really familiar with technical analysis. So I couldn’t help you on this. Maybe you can Google for Technical Analysis on Stock Chart to learn more about it.
How do I automatically receive the quarterly report to my phone once it is announced. Last time I used to receive the quarterly report to my phone upon release of the report
Hi Cyndi,
If you mean receiving notification, you need to add the stock in a watchlist, then at the watchlist page, click 3 dots at top right corner and choose notification. You should enable “announcement” for your watchlist, so you will receive quarterly report notification.
Can try KLSE 2U, it got dedicated quarterly report release notification via app and email, free